Chapter 3: Economic Evaluation – A Core Tool
This chapter explains how economic evaluation helps decision-makers compare healthcare interventions. It introduces the main approaches which are cost-effectiveness, cost-utility, cost-benefit, and cost-minimization analysis and shows how each method guides choices about which interventions provide the greatest value for money. The focus is on practical understanding rather than complex math.
3.1 What is Economic Evaluation?
Economic evaluation is the formal comparative analysis of alternative interventions in terms of both costs (resources used) and consequences (outcomes achieved). It enables decision-makers to judge the “value for money” of healthcare options and to allocate limited resources more efficiently.
There are four main approaches to economic evaluation, each differing in how outcomes are measured:
- Cost-Minimization Analysis (CMA): Applied only when outcomes are proven to be equivalent across interventions. The analysis focuses solely on identifying the least costly option.
- Cost-Benefit Analysis (CBA): Measures both costs and outcomes in monetary units. While theoretically useful, it is less common in healthcare due to difficulties in assigning monetary values to health outcomes such as life-years gained. Results may be expressed as a net present value or a benefit-to-cost ratio.
- Cost-Effectiveness Analysis (CEA): Evaluates outcomes in natural health units, such as symptom-free days, cases averted, or life-years gained. Results are often presented as an Incremental Cost-Effectiveness Ratio (ICER).
- Cost-Utility Analysis (CUA): The most widely accepted approach, particularly by health technology assessment (HTA) agencies. It measures outcomes in Quality-Adjusted Life Years (QALYs), which combine survival length with quality of life (scored 0 = death, 1 = perfect health). QALYs allow comparisons across different interventions.
- Cost-Consequence Analysis (CCA): CCA presents costs and a range of outcomes in a disaggregated format without combining them into a single ratio like ICER. This allows decision-makers to weigh trade-offs explicitly.
3.2 Understanding Costs in Healthcare
In healthcare economics, “cost” refers to the value of resources consumed in delivering services or interventions. Costs are generally grouped into three categories:
- Direct Medical Costs – Expenses directly associated with patient care.
Examples
hospital stays, diagnostic tests, medications.
- Direct Non-Medical Costs – Expenses incurred by patients and families that are directly related to receiving healthcare but are not medical in nature.
Examples
transportation to health facilities, accommodation for long-distance treatments, meals during hospital stays, and caregiving expenses. - Indirect Costs – Productivity losses due to illness, disability, or premature death.
Examples
missed workdays, reduced earning capacity.
- Intangible Costs – Hard-to-measure impacts such as pain, distress, or reduced quality of life.
Examples
anxiety from chronic illness, emotional burden on families.
3.3 What is Effectiveness?
Effectiveness describes the extent to which an intervention achieves its intended outcome in real-world conditions.
Examples
A flu vaccine that prevents 80% of cases in the community is considered highly effective.
This differs from efficacy, which is measured in controlled clinical trials under ideal conditions. Policymakers prioritize effectiveness since it reflects practical results in population-level health systems.
3.4 Applying Cost and Effectiveness in Decision-Making
Because healthcare resources are finite, decision-makers must evaluate trade-offs between cost and effectiveness:
- A treatment that costs less while providing equal or better health outcomes is more cost-effective.
- Economic evaluation ensures that the greatest possible health benefits are achieved within budget constraints.
This process supports transparent and rational policy choices, guiding governments and institutions toward investments that improve population health at sustainable costs.
3.5 Understanding the Incremental Cost-Effectiveness Ratio (ICER)
The ICER is a central concept in economic evaluation. It is calculated as:

It expresses the additional cost required to gain one extra unit of health outcome (e.g., one QALY gained).
Interpretation:
- If the ICER is below the willingness-to-pay (WTP) threshold, the intervention is considered cost-effective.
- If the ICER is above the threshold, it is not considered a good investment.
- Importantly, cost-effective ≠ cost-saving. Some interventions may cost more but still provide value worth paying for.
3.6 Interpreting ICER: The Role of Cost-Effectiveness Thresholds
Once the ICER (Incremental Cost-Effectiveness Ratio) is calculated, it must be compared to a cost-effectiveness threshold to determine whether an intervention offers good value for money.
The threshold represents the maximum amount a society is willing to pay (WTP) for one additional unit of health gain, such as a Quality-Adjusted Life Year (QALY).
WHO-Recommended Threshold Approach
According to the World Health Organization (WHO):
-
ICER < 1× GDP per capita → The intervention is considered very cost-effective.
-
ICER between 1–3× GDP per capita → The intervention is cost-effective.
-
ICER > 3× GDP per capita → The intervention is not cost-effective.
For Malaysia, with a GDP per capita of approximately RM 120,000, this means:
-
Interventions with an ICER below RM 120,000 per QALY are considered very cost-effective.
-
Those between RM 120,000 and RM 360,000 per QALY are cost-effective.
-
Above RM 360,000 per QALY, interventions are generally not cost-effective.
Examples
Willingness-to-Pay (WTP) Threshold
Some countries use a Willingness-to-Pay threshold instead of a GDP-based one. This approach reflects what the public or decision-makers are realistically willing to invest for a health gain, based on local budget constraints, equity priorities, and societal preferences.
Examples
and Malaysia’s threshold = RM 120,000 per QALY,
then the intervention is considered cost-effective, as it provides health gains at a cost society is willing to pay.
3.7 Cost-Effectiveness Plane
A graphical representation of costs (y-axis) against effects (x-axis):
- Southeast quadrant: Less costly, more effective → Dominant (best choice)
- Northeast quadrant: More costly, more effective → Cost-effective if below WTP threshold
- Northwest quadrant: More costly, less effective → Dominated (not recommended)
- Southwest quadrant: Less costly, less effective → Context-dependent
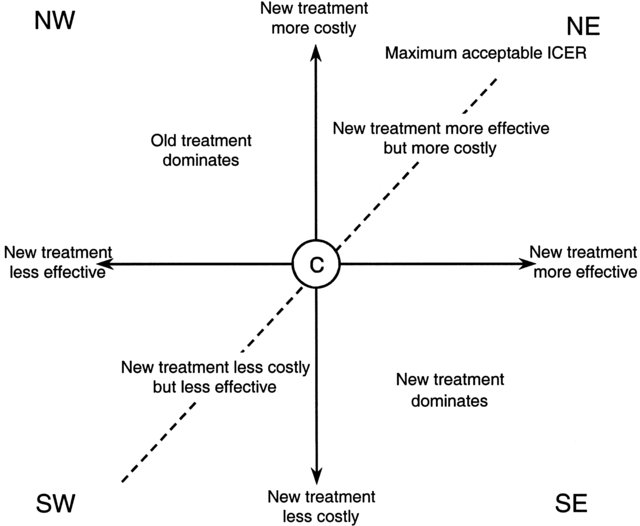
adopted from Briggs, A., & Tambour, M. (2001). The design and analysis of stochastic cost-effectiveness studies for the evaluation of health care interventions.
Examples
In Canada, the informal WTP threshold ranges between CAD $50,000–$100,000 per QALY gained.
3.8 Summary
Economic evaluation is an indispensable tool for health system decision-making. By balancing costs with outcomes, it ensures the best use of limited resources to maximize health gains. For health professionals, understanding these principles allows for evidence-based clinical and policy decisions that improve population well-being.
