7 MOTION VISUALIZATIONS
|
|
By the end of this chapter, readers will be able to:
|

Motion Line Chart
Motion line charts, also known as animated line charts, not only make data presentations more engaging but also allow us to observe how values fluctuate over a specific time range. This helps in identifying any exciting or abnormal value transitions. In Tableau, you can create a motion line chart by placing a date field on the Pages shelf. This will split the line chart into a series of pages, creating animations that clearly show how values change over time, such as years, quarters, or months.
Exercise 31
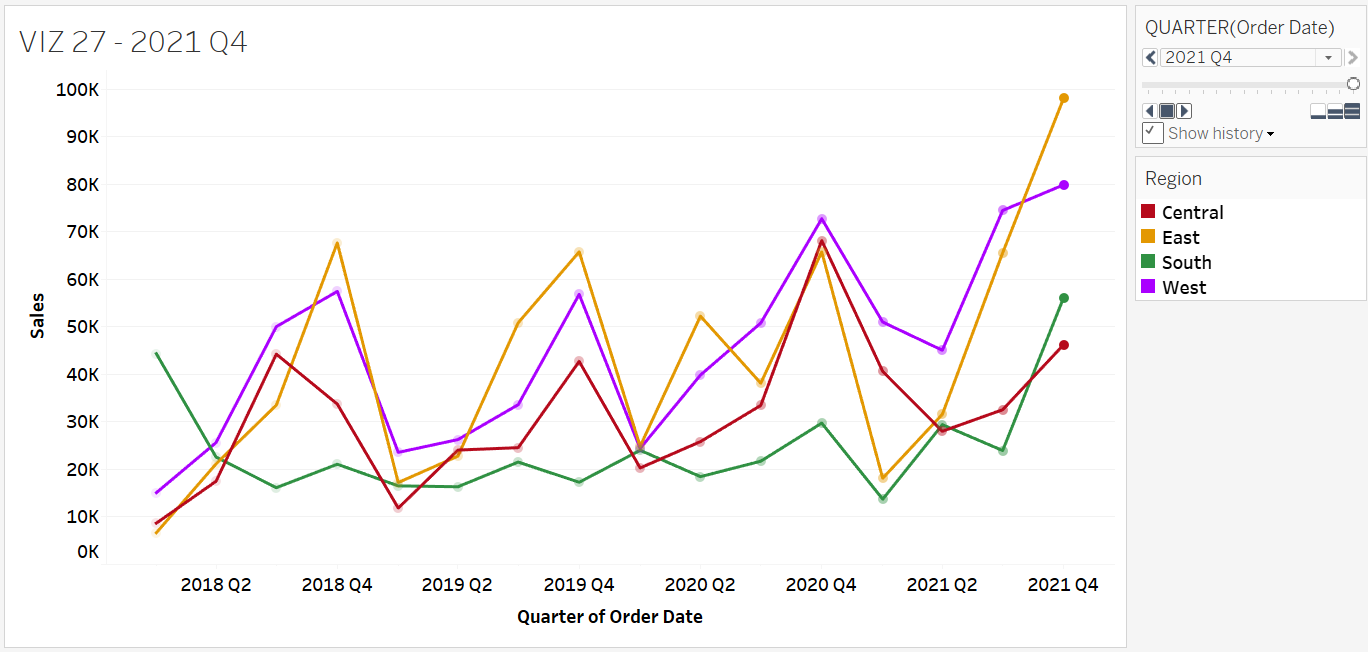
Create a motion line chart to illustrate the fluctuations in total sales across different regions over various quarters and years.
Solution – Exercise 31
Step 1: Drag and drop the Order Date onto the Columns shelf and the Sales field onto the Rows shelf. Name the resulting line chart VIZ 27.
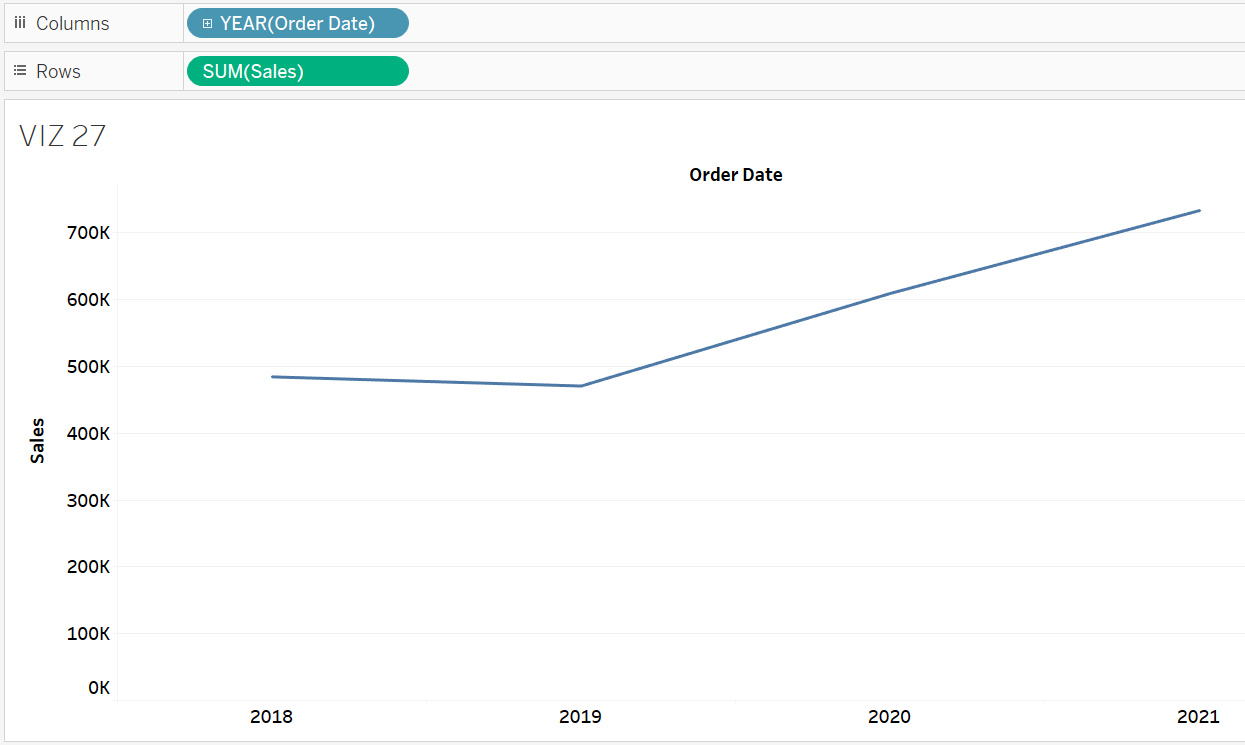
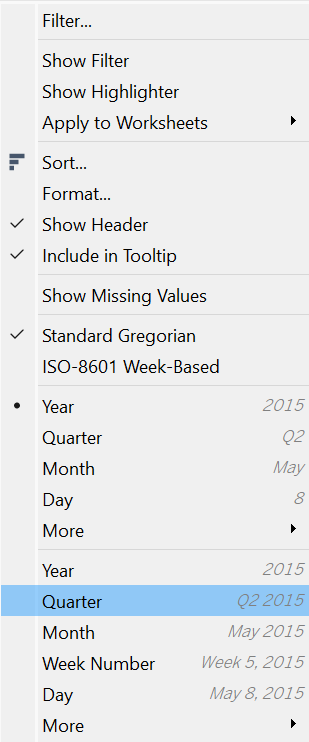
Step 2: Click the down arrow next to the Order Date field in the Columns shelf. Under the continuous date format section, choose Quarter to change the time frame to quarters by year.
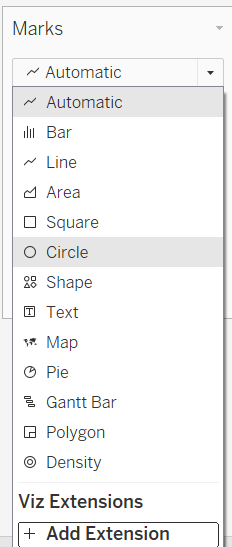
Step 3- Change the type of marks to Circle.
Step 4: Press and hold the Ctrl key, then click and drag the QUARTER(Order Date) field from the Rows shelf to the Pages shelf.
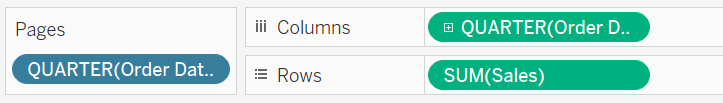
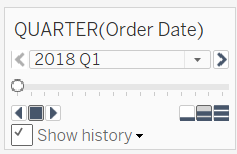
Step 5: Check the Show History box in the Pages card, appearing to the right of the worksheet.
Step 6: Click the down arrow next to Show History. For a standard animated chart, choose All under the Marks to Show History For, and choose Both in the Show section.
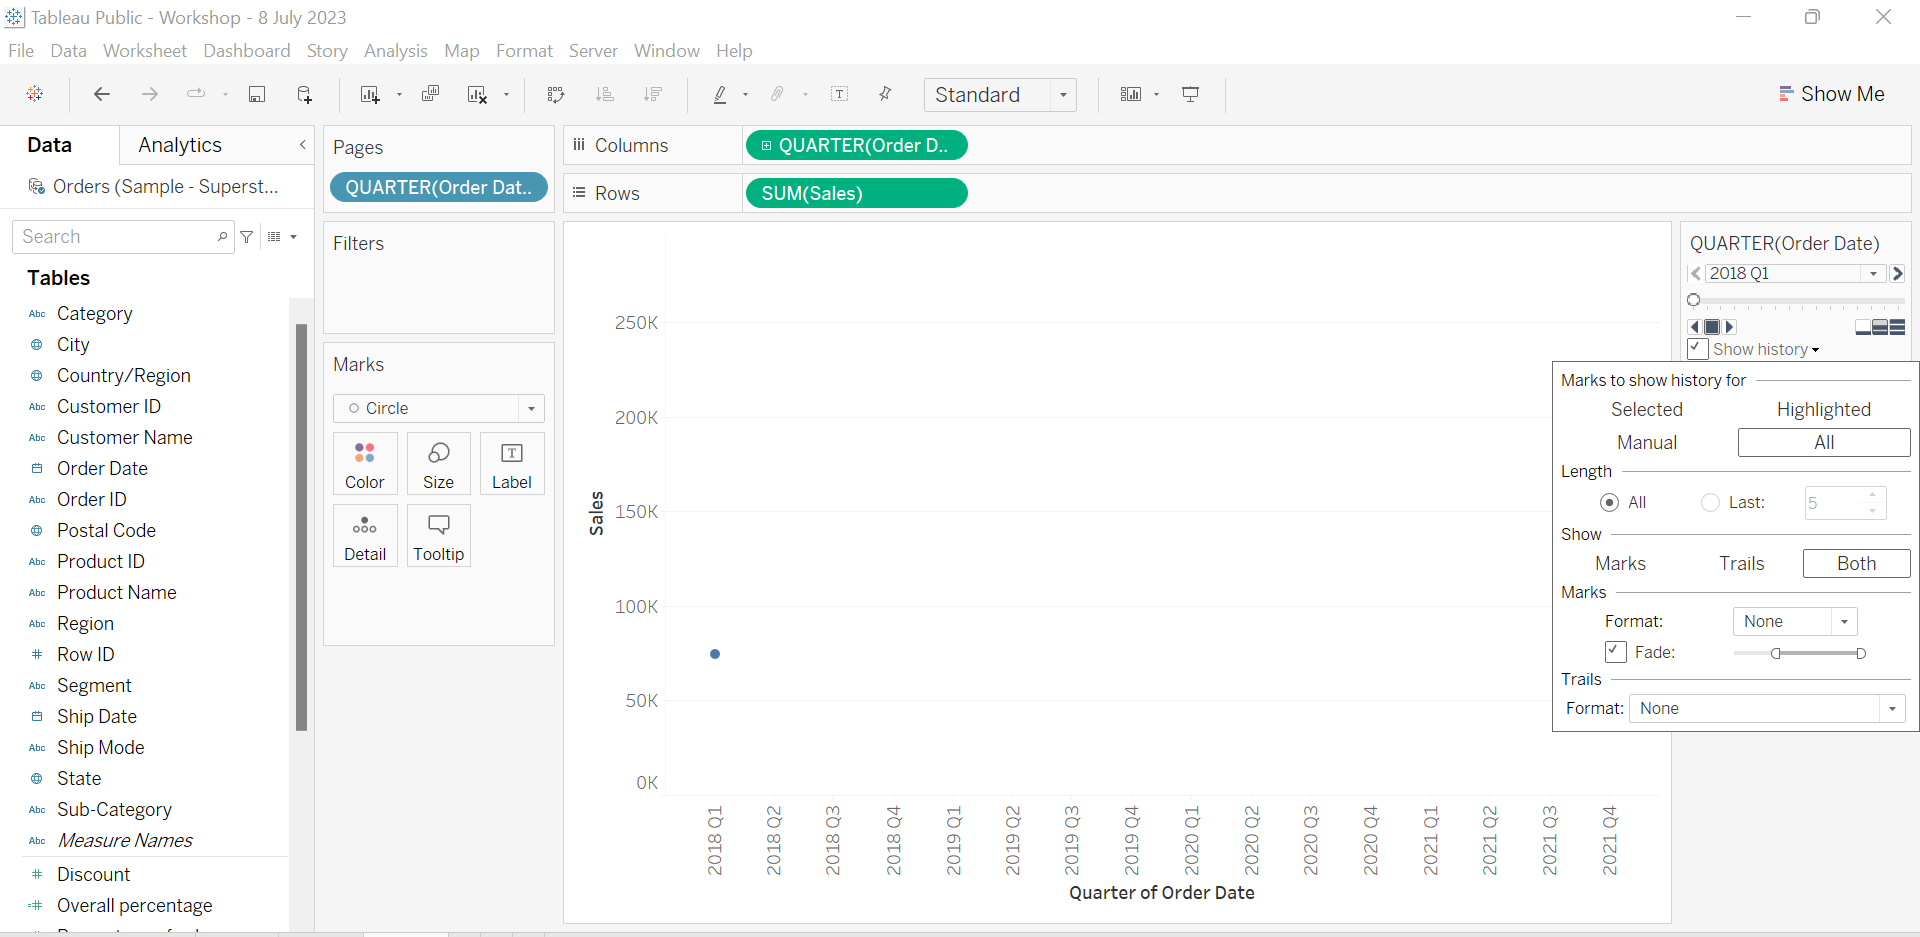
Step 7: Add the Region field to the Colour Card to display different lines for each region within the same chart.
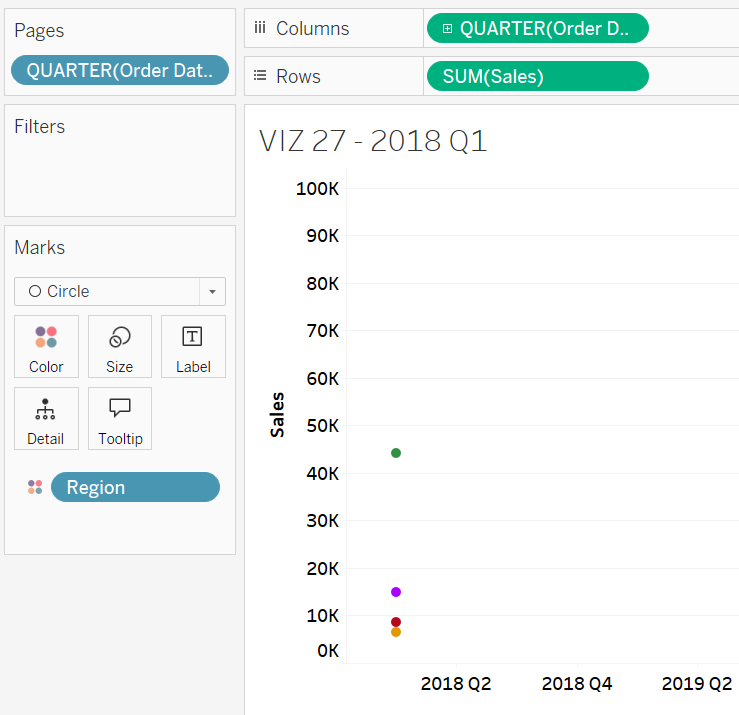
Step 8: Click the Play button on the Pages card to observe how sales fluctuate for each region across different periods. Note that we can also control the speed of the animations using the options available on the Pages card.
Speed control
Race Bar
Race bars help illustrate how multiple items, such as states, regions, or companies, perform or change over time. A race bar helps trace progress, evaluate growth, or detect shifts in data. In Tableau, a race bar can be created using the Pages shelf to animate changes in the data, allowing users to show how values evolve over different periods.
Exercise 32
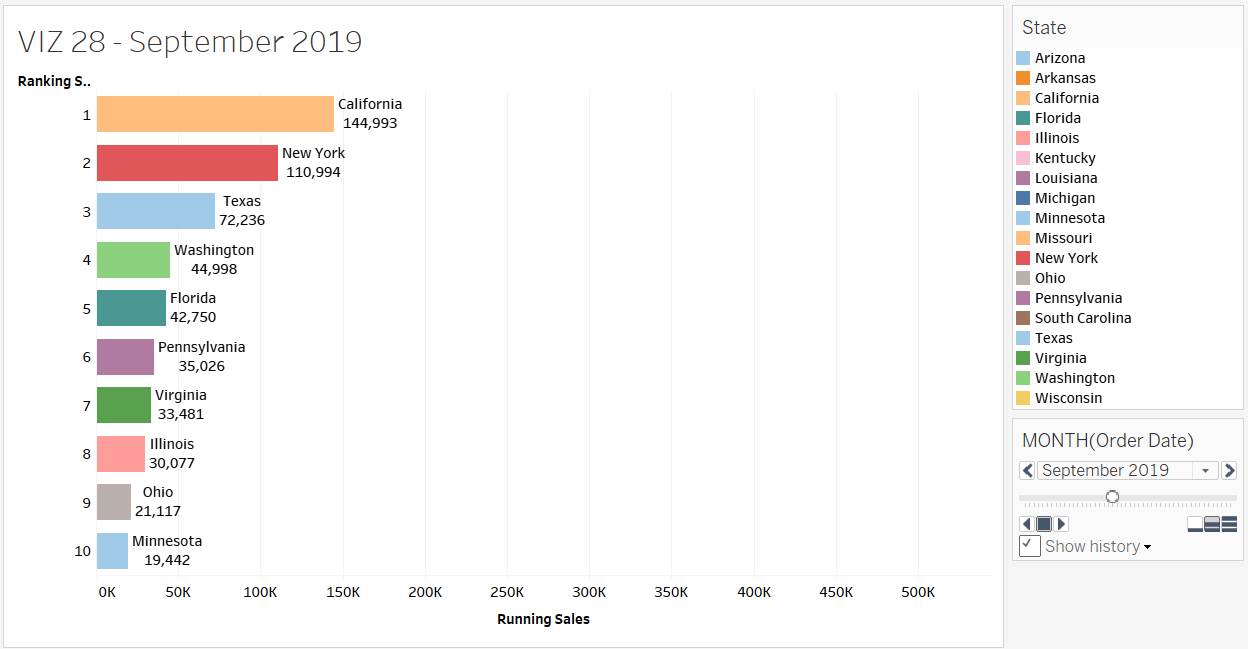
Construct a race bar chart to display the top ten states for each quarter and year, based on total sales.
Solution – Exercise 32
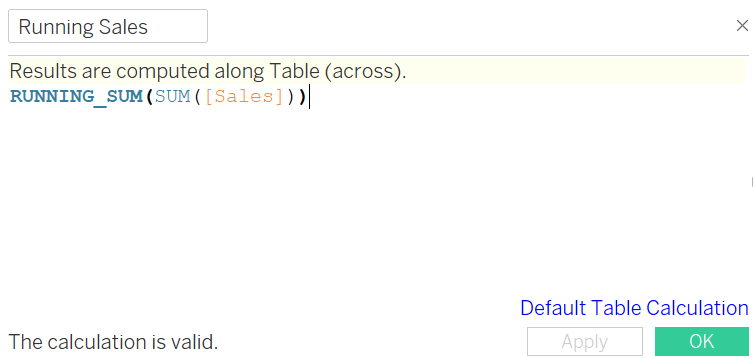
Step 1: Open a new worksheet and name it VIZ 28. Create a calculated field for the running sales using the RUNNING_SUM function. Name the calculated field Running Sales.
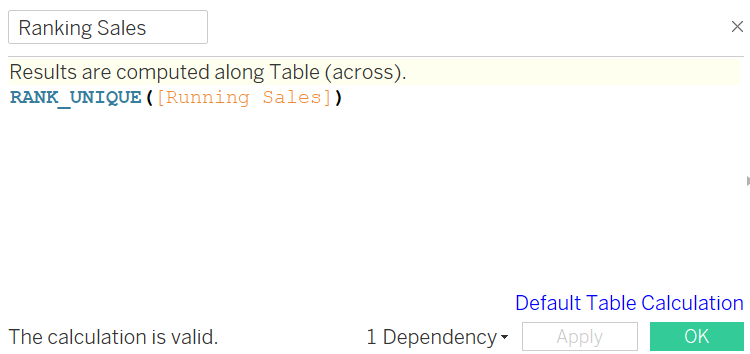
Step 2: Create a calculated field using the Rank_Unique function to rank the running sales. Use the following expression, which incorporates the Running Sales field. Name the calculated field Ranking Sales.
Step 3: Drag the Sales field onto the Columns shelf and the Ranking Sales field onto the Rows shelf. Add the State field to the Colour Card.
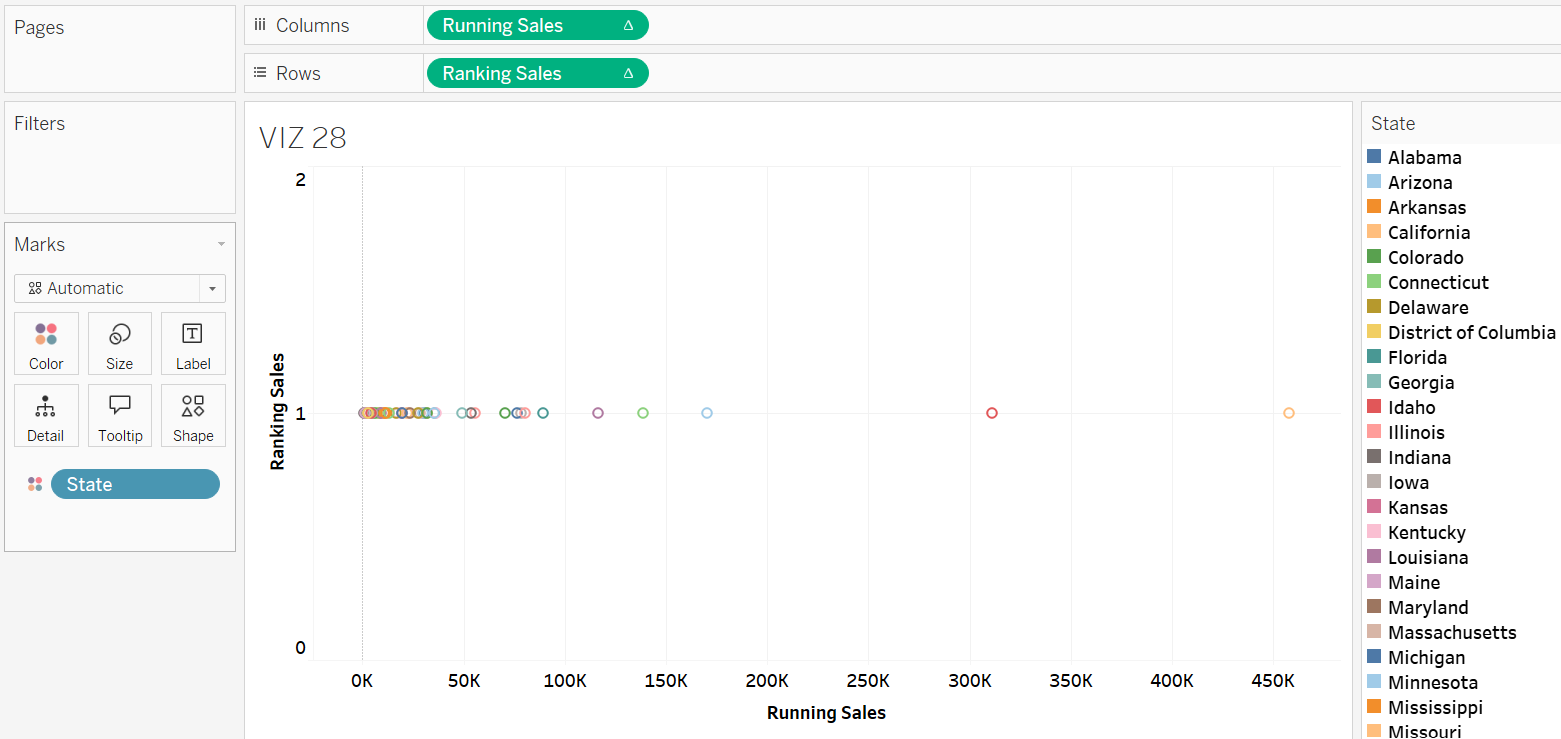
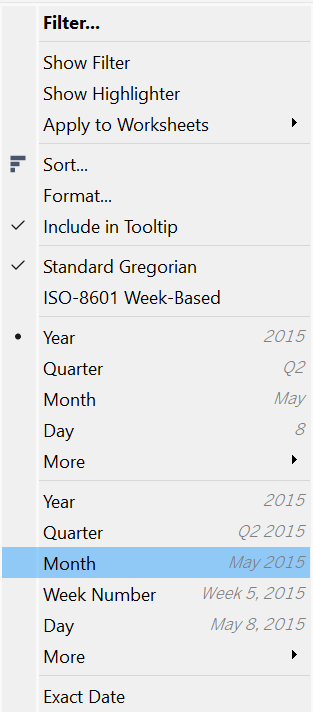
Step 4: Add the Order Date field to the Pages shelf. Click the down arrow next to the added Order Date and choose Month under the continuous date options. This allows Tableau to organize the data into separate pages by month and year.
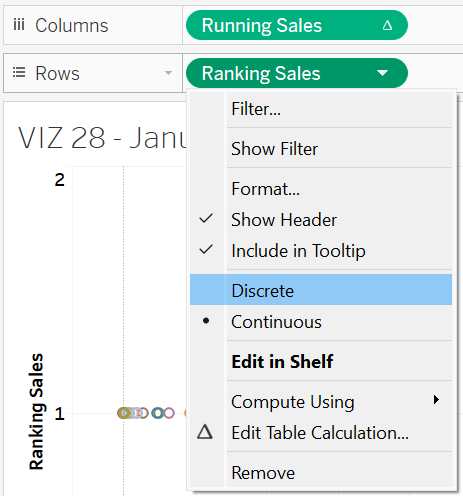
Step 5: Click the down arrow next to the Ranking Sales field in the Rows shelf. Set the Ranking Sales field to Discrete.
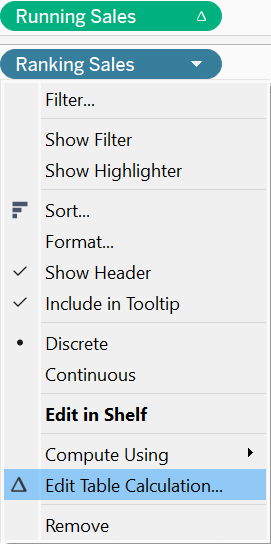
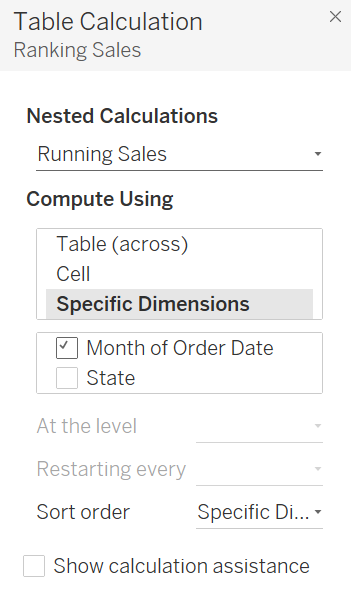
Step 6: Click the down arrow next to the Ranking Sales field in the Columns shelf and choose Edit Table Calculation.
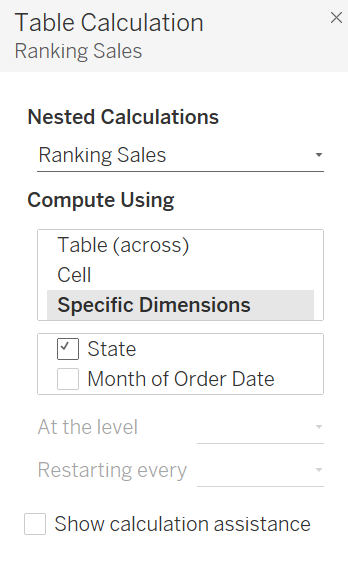
Step 7 – Under Compute Using, choose Specific Dimensions to select the State field. Then, switch the Nested Calculations option to Running Sales, and click Specific Dimensions to choose Month of Order Date. Also, make sure the Running Sales field on the Columns shelf has the same calculation setting by verifying its Table Calculation; it should be computed using the Month of Order Date. This setup ensures that Tableau calculates the ranking sales by State for each Month of Order Date, with running sales computed by Month of Order Date for each State.
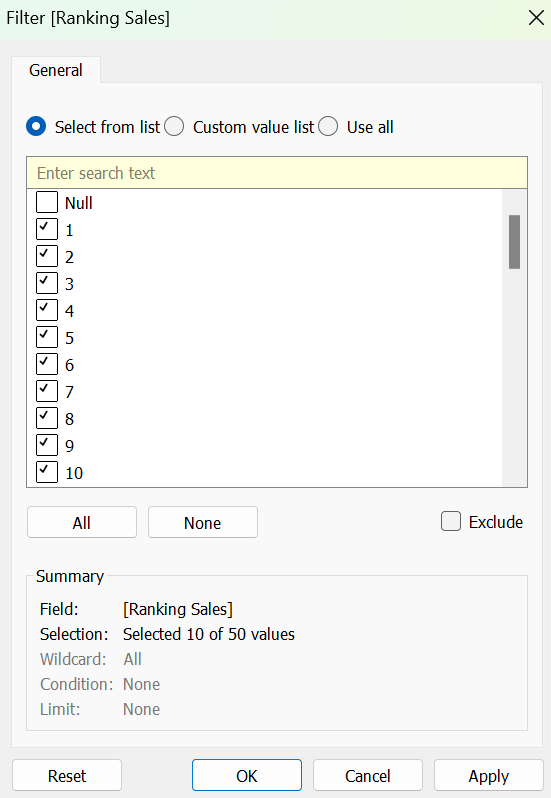
Step 7: Copy the discrete Ranking Sales field from the Rows shelf and add it to the Filter shelf. To do this, hold the Ctrl button, click the Ranking Sales field in the Rows shelf, and drag it onto the Filter shelf. Then, edit the filter to display only the ten states with the highest running sales.
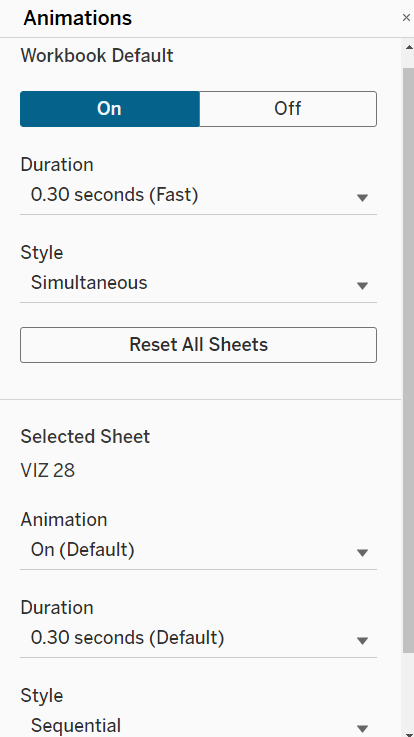
Step 8: Click Format on the toolbar and choose Animations. In the Animations setting, configure the Style and Duration of the animation according to your preferences.
Step 9: Add the State and Running Sales fields to the Label Card. For an improved animation experience, save the completed race bar to your Tableau Public profile and press play in the Pages control card to see the transitions between bars at different time points.