4 GROUPS, SETS, AND COMBINED SETS
|
|
By the end of this chapter, readers will be able to:
|

Grouping Dimension Members
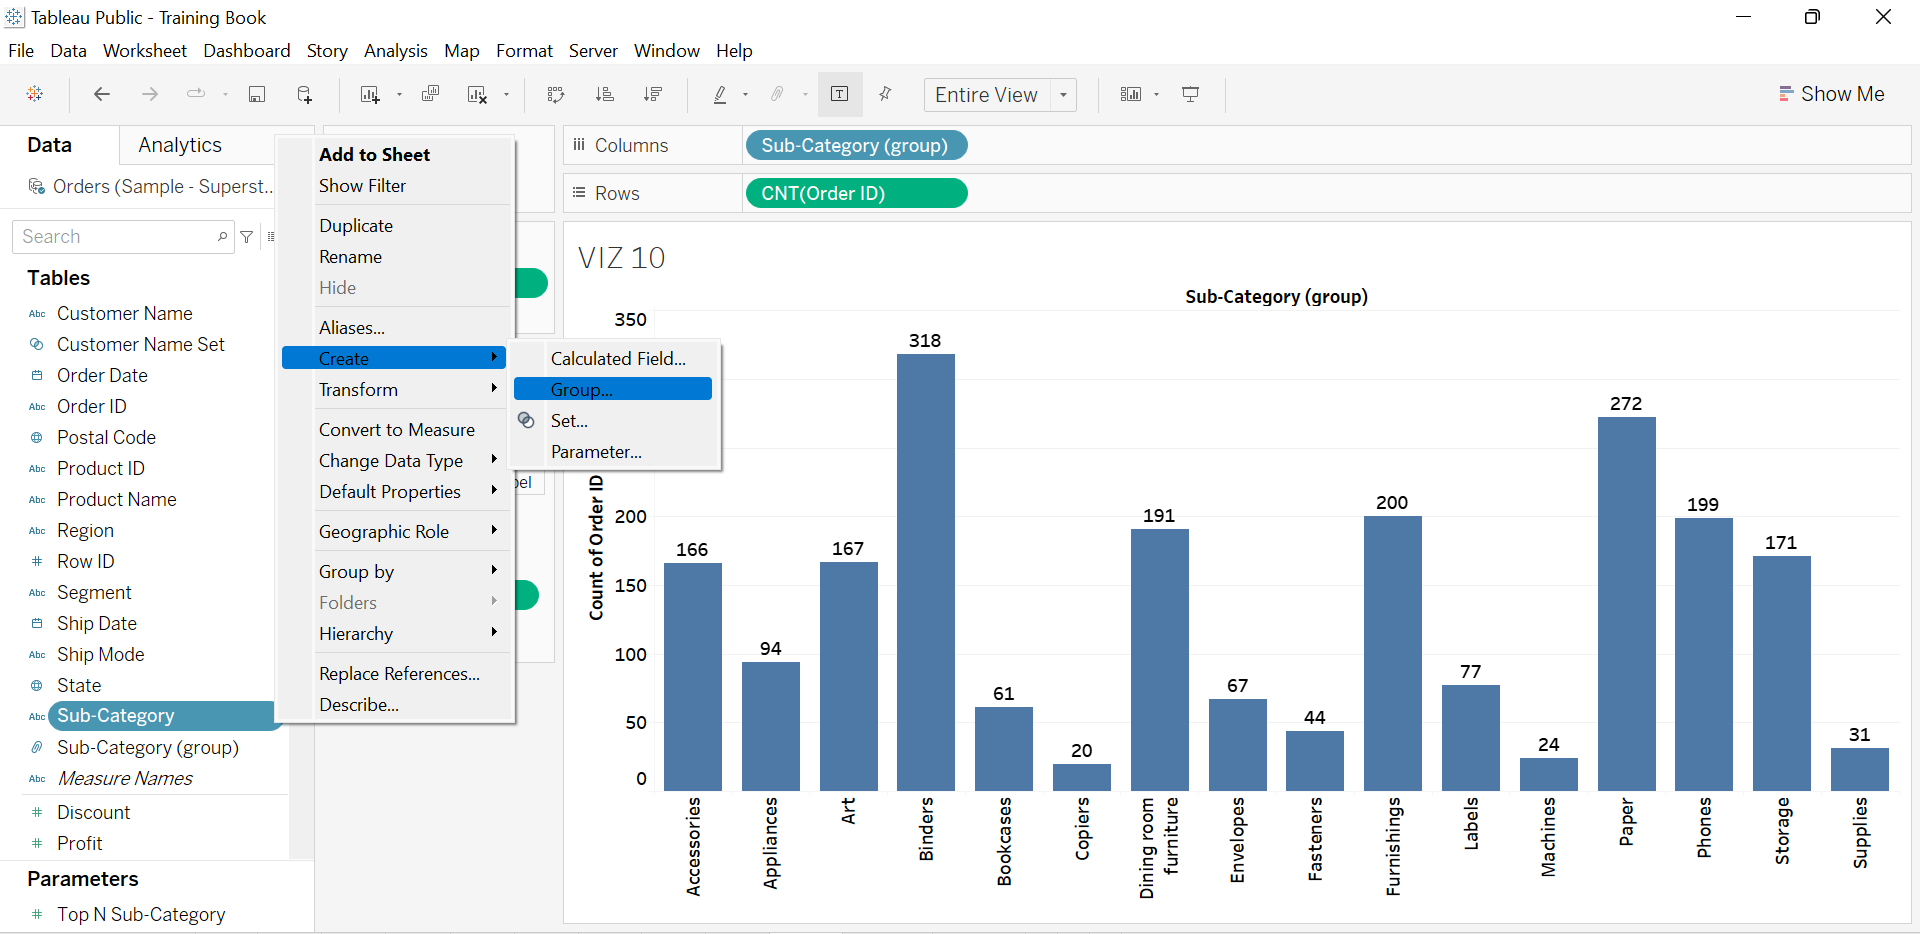
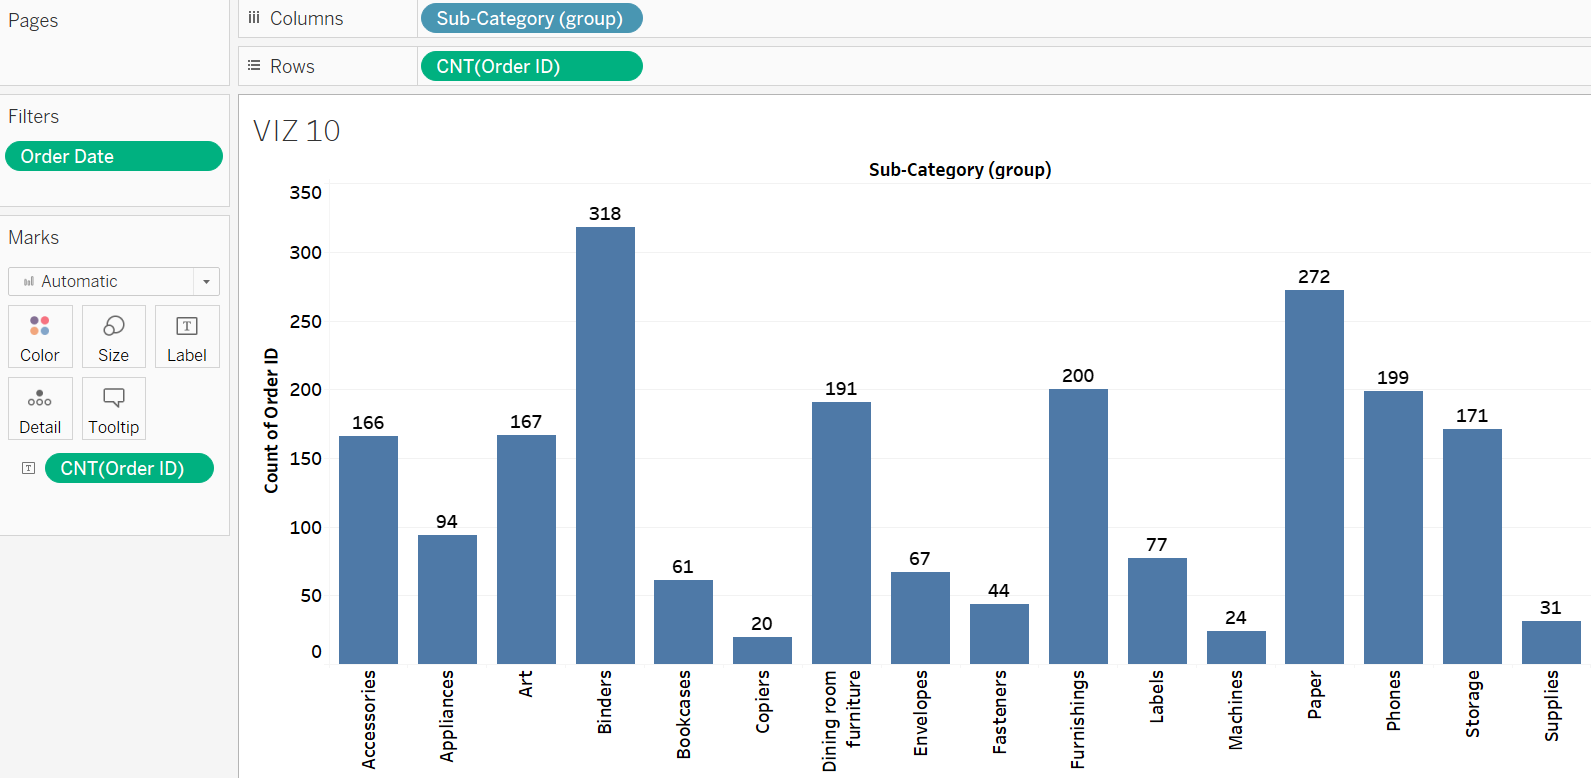
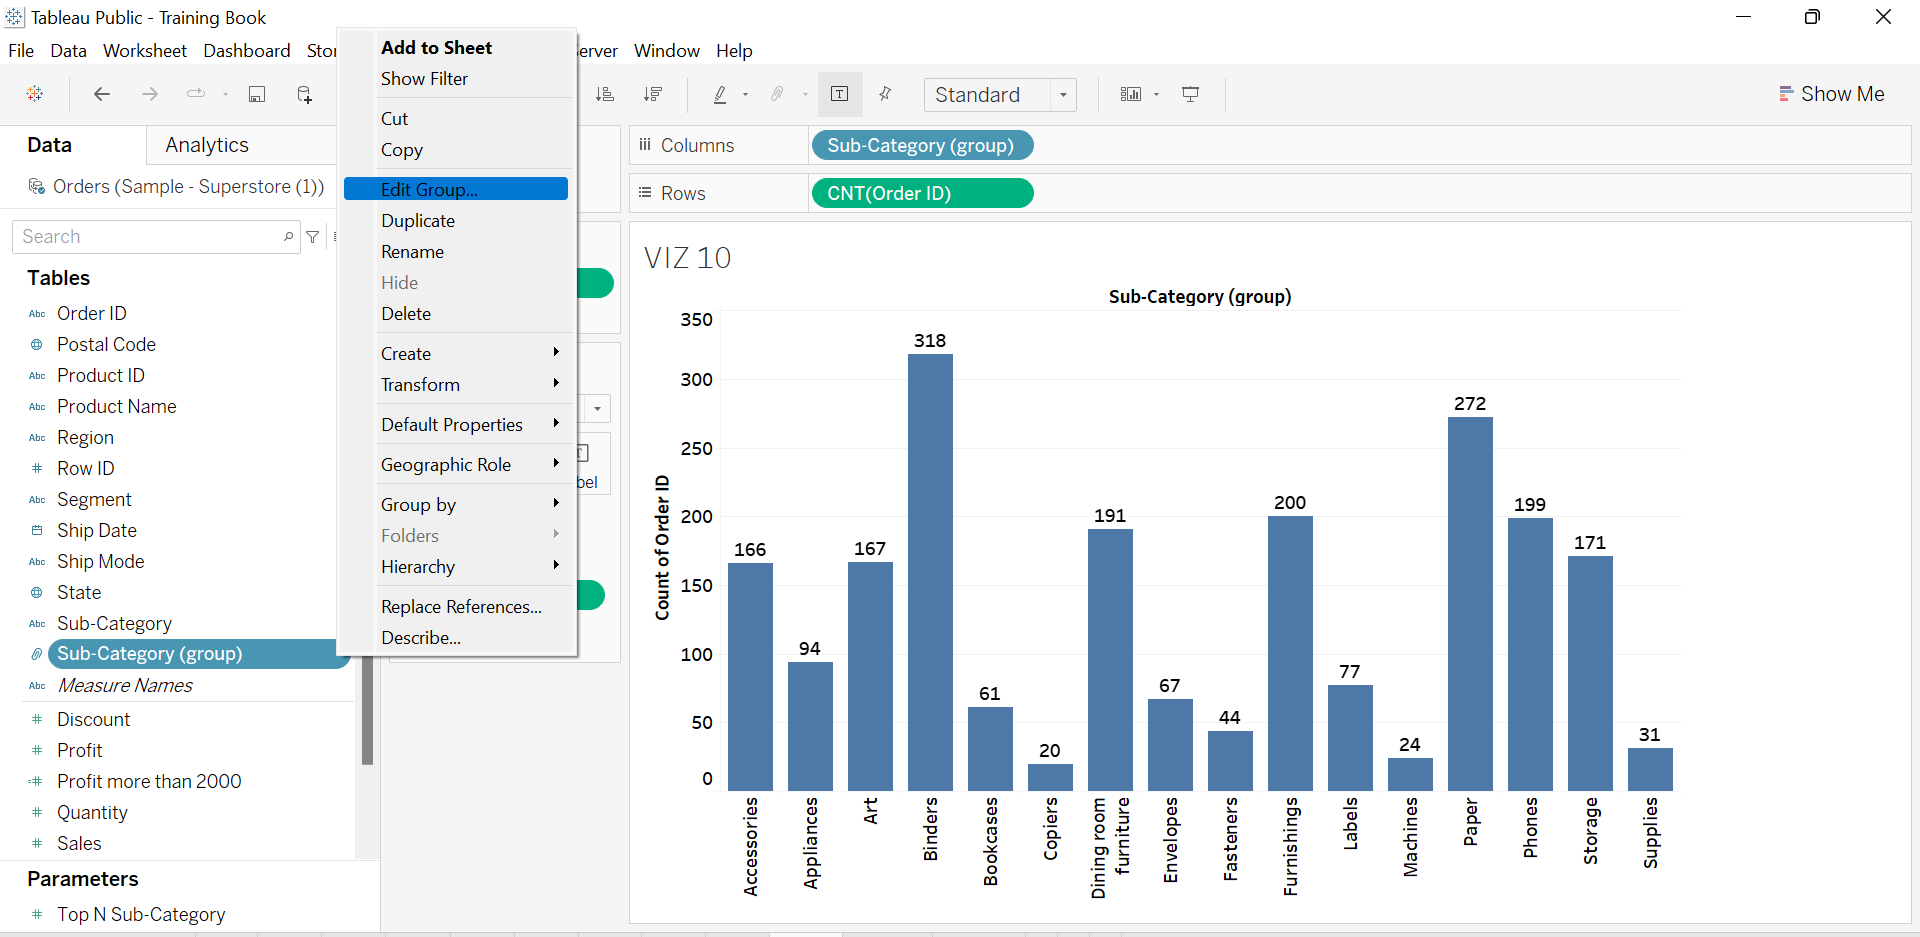
The group feature in Tableau can be used to merge related dimension members in a visualization. For instance, assume that we want VIZ 10 to show the combined number of orders for dining room furniture, which includes chairs and tables. As such, firstly, click the Sub-Category field in the Data Pane, then choose Create, followed by Group (Note: Clear the sorting in VIZ 10 before proceeding with this step).
In the Group setting, choose both the Chairs and Tables using the Ctrl button, and click OK.
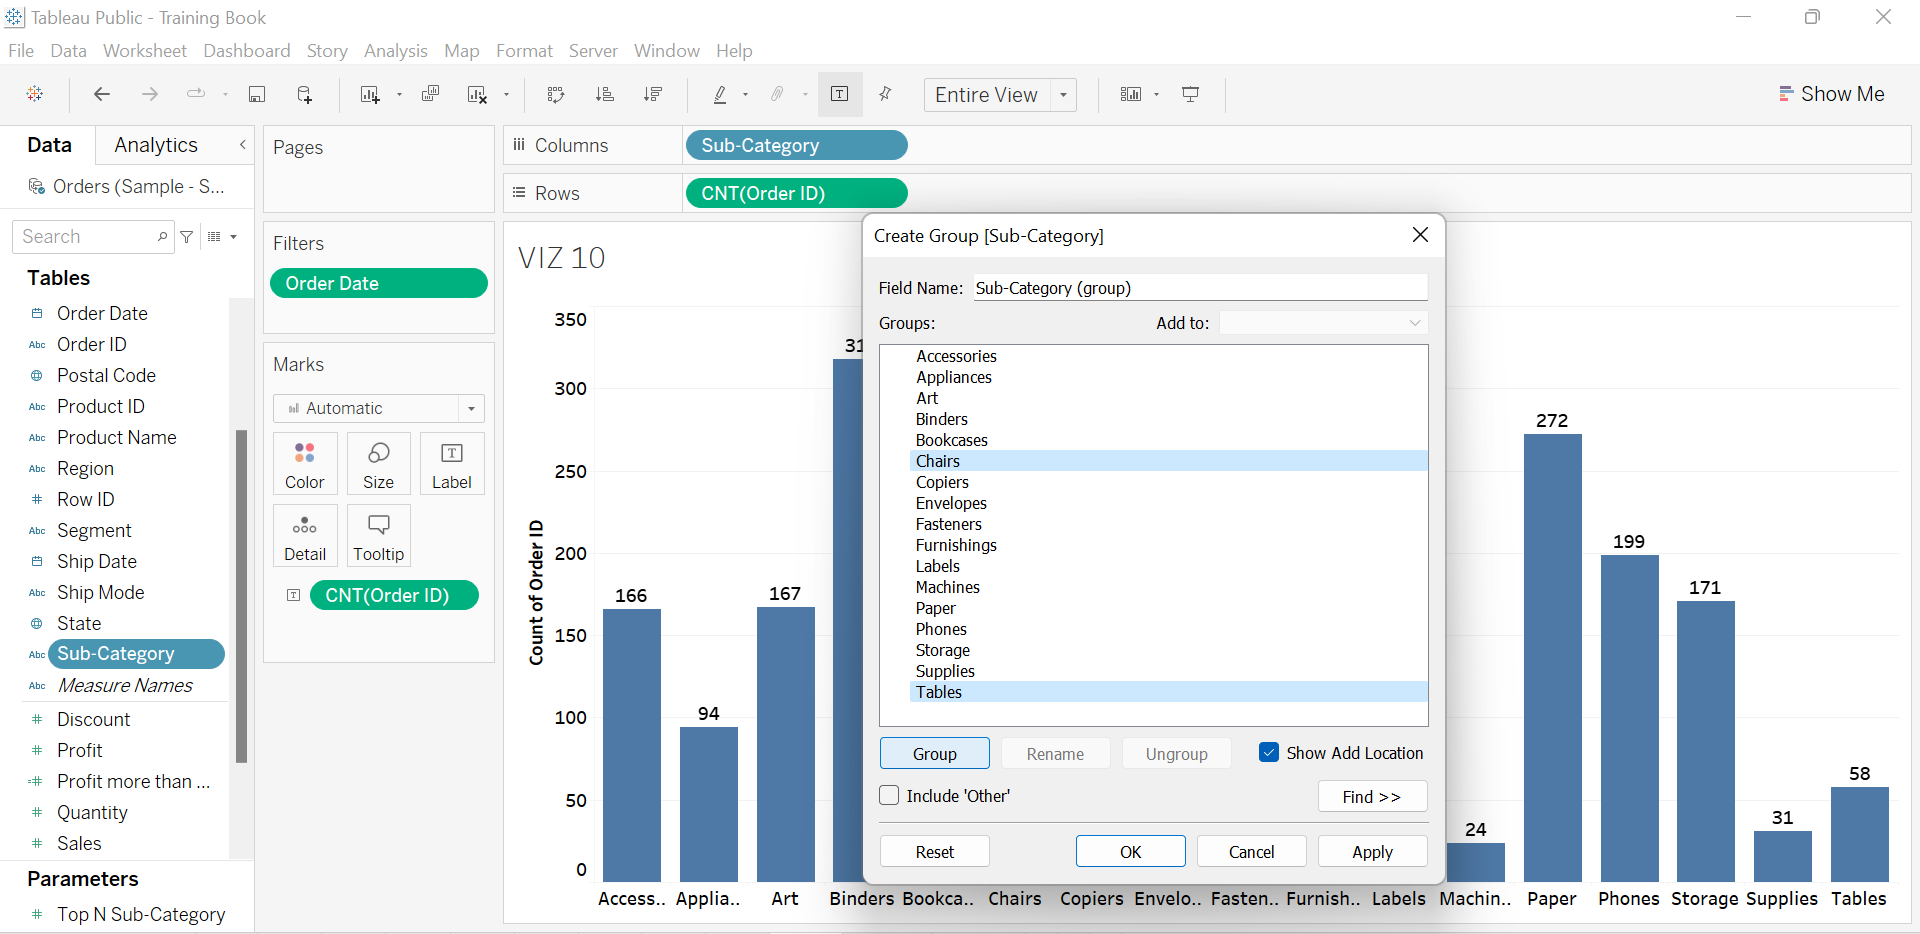
Rename the group to Dining Room Furniture and click OK.

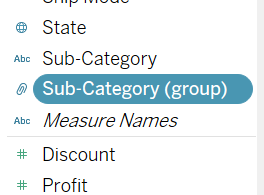
The group field for Sub-Category items is typically created in the Data Pane, identified by the accompanying paperclip icon.
Drag the Sub-Category field from the Data Pane and replace it with the Sub-Category (group) to depict the combined total number of orders for both Chairs and Tables in VIZ 10.
Users may utilize the Edit Group function by clicking the field in the Data Pane if they wish to form more groups within a dimension field.
Sets in Tableau
Set offers a more dynamic way for the users to group the dimension members. It helps users to identify and group dimension members that meet a specific condition. In Tableau, dimension members that meet the condition as grouped as IN items. Otherwise, they are considered OUT items. The IN items can be coloured differently to grab the audience’s attention during the data presentation.
Exercise 16
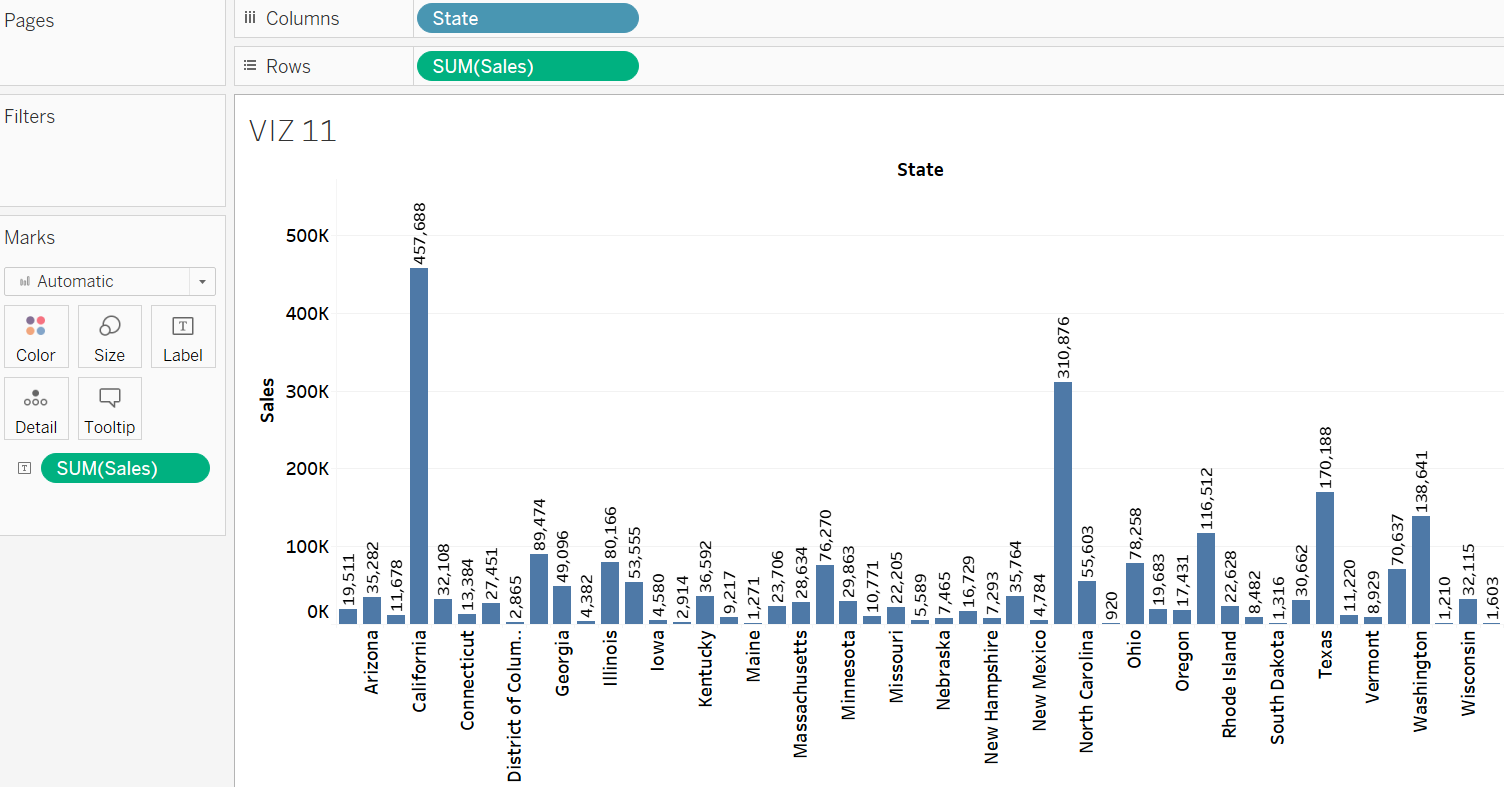
Create a visualization to show total sales per state. Name the visualization VIZ 11. Using a set, identify the states with total sales above $100,000. Colour the states meeting this condition differently.
Solution – Exercise 16
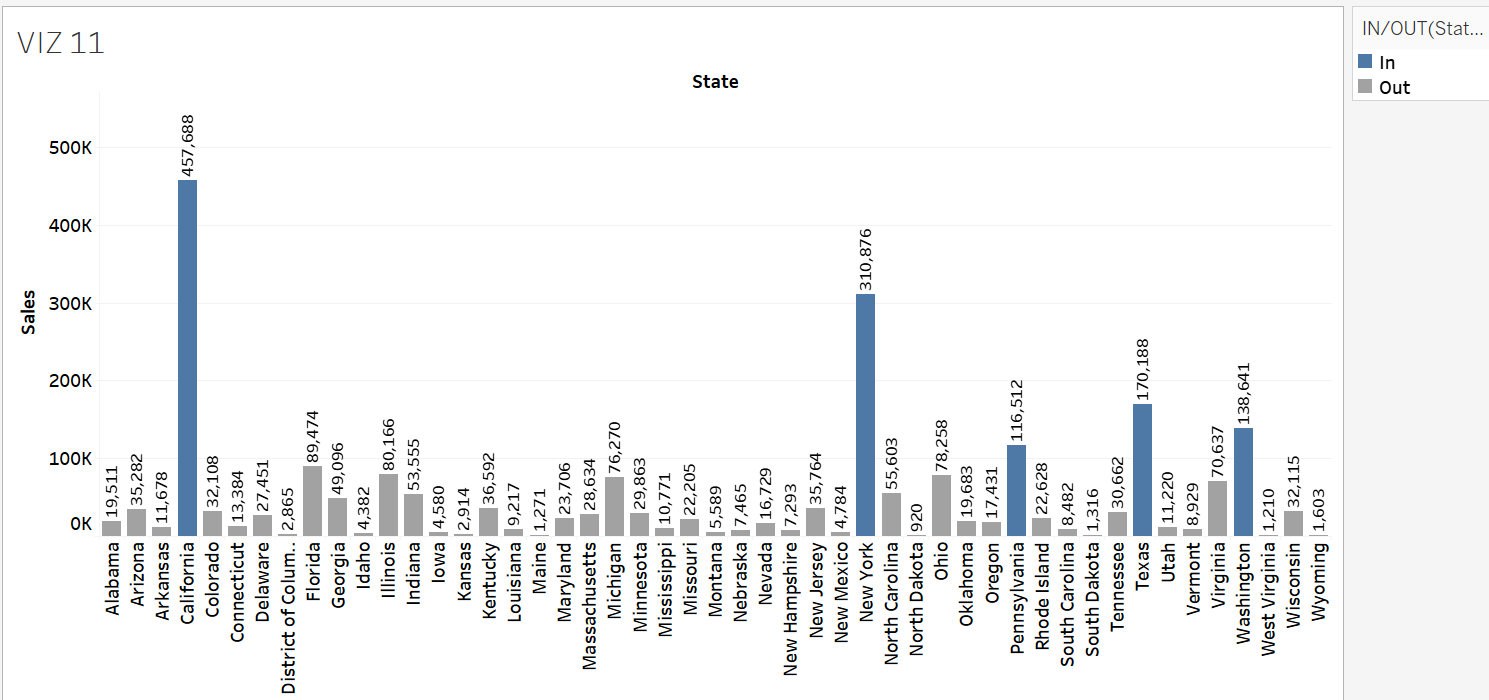
Step 1: Drop the State field to the Columns shelf and the Sales field to the Rows shelf to create VIZ 11.
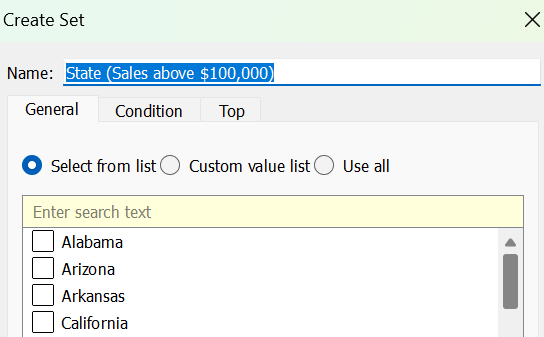
Step 2: To create the set field, click State in the Data Pane and choose Create, followed by Set.

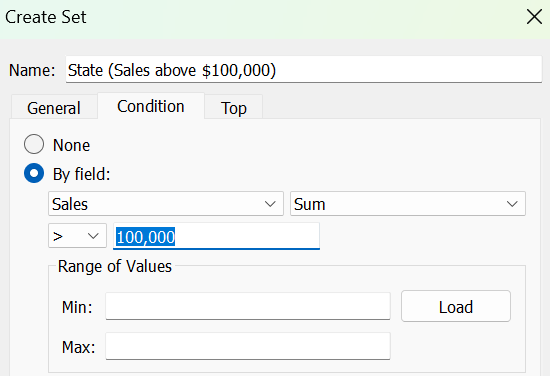
Step 3: Name the set State (Sales above $100,000), reflecting its characteristics.
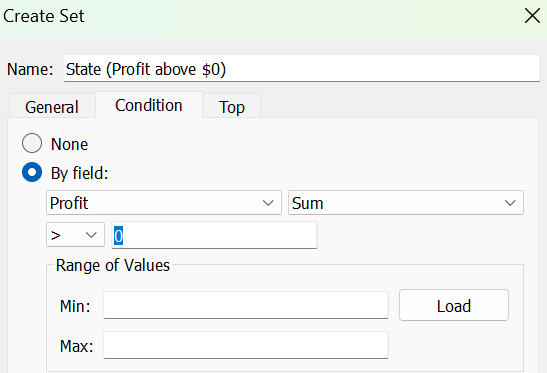
Switch to the Condition tab. Set the prefixed condition, i.e., Sum of Sales > $100,000, in the By Field section.
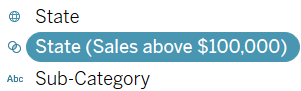
The newly created set field, i.e., State (Sales above $100,000), will be available at the Data Pane once the OK button is clicked. In Tableau, the set field is usually denoted by a Venn diagram icon.
Drag and drop the set field in the Colour Card. We can now notice that all the states with total sales above $100,000 are coloured oddly. In this case, they are coloured in blue. The visual below shows that there are five states which satisfy the condition of the set field, which are California, New York, Pennsylvania, Texas, and Washington.
Combined Sets
In Tableau, a combined set is a set that is created to merge two or more individual sets using set operations such as union, intersection, or difference. Combined sets are particularly useful when users want to analyze data based on multiple conditions simultaneously.
Exercise 17
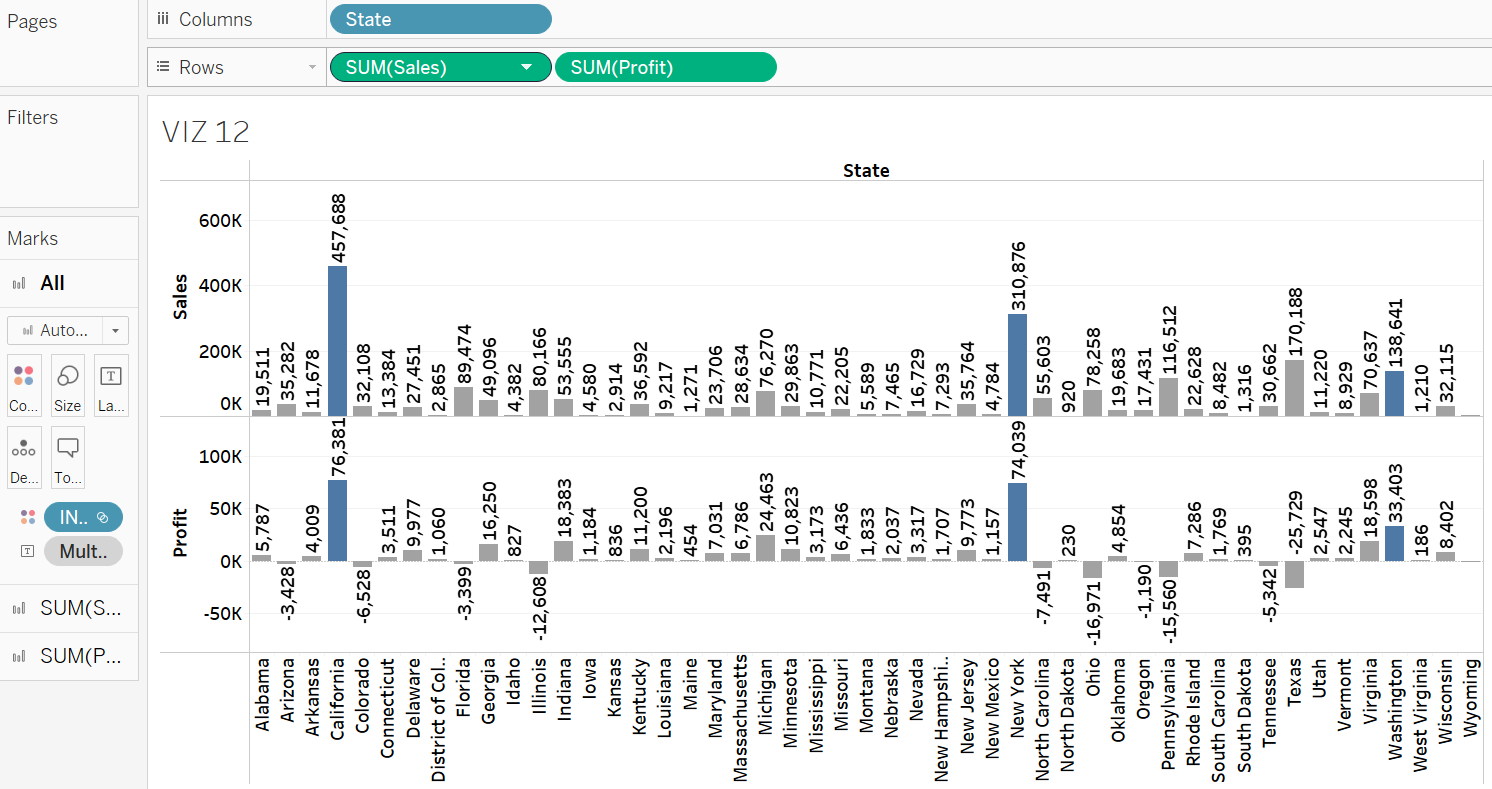
Create a visualization to show total Sales and Profit per State. Name the visualization VIZ 12. Using set and combined set, identify the states with total sales and total profit above $100,000 and $0, respectively. Colour the states meeting this condition differently.
Solution – Exercise 17
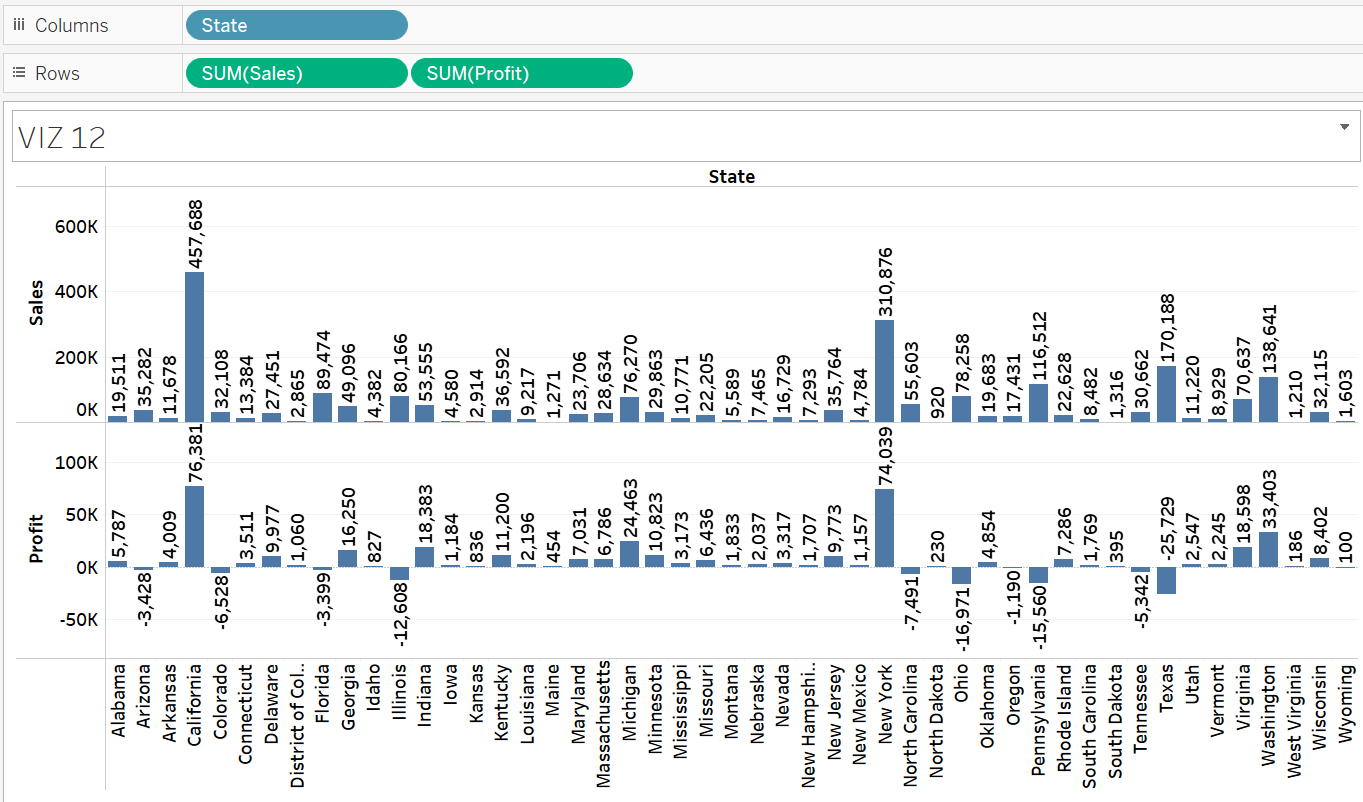
Step 1: Drop the State field to the Columns shelf. Also, drop both the Sales and the Profit fields to the Rows shelf to create VIZ 12.
Step 2: Using similar steps, create another set field to group the profitable states, i.e., states with at least $0. Name the set State (Profit above $0).
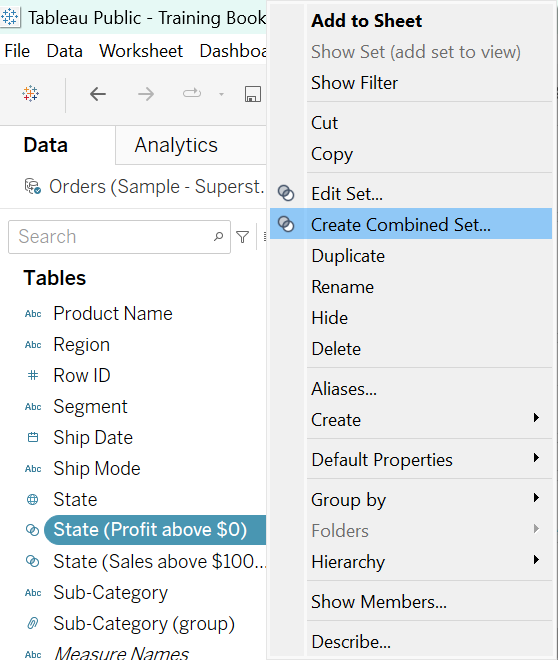
Step 3: Click the State (Profit above $0) set in the Data Pane and choose Create Combined Set.
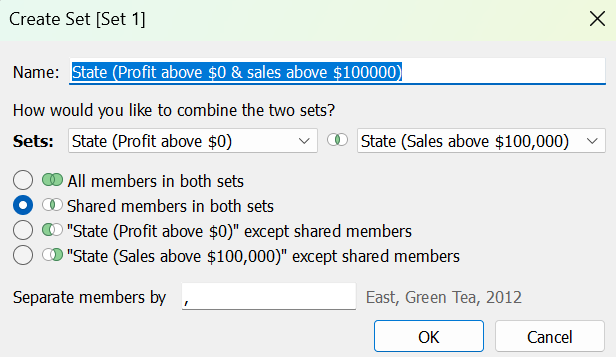
Step 4: Rename the combined set to State (Profit above $0 & sales above $100000). Choose the State (Sales above $100,000) set to combine with. Pick Shared Members in Both Sets to group states that meet both criteria.
Step 5: Drag the combined set from the Data Pane and drop it onto the Colour Card. We can observe that states with total profits and total sales of at least $0 and $100,000, respectively, are highlighted in a distinctive colour, such as blue in this instance. The results detect three states meet both conditions: California, New York, and Washington.